
Azure Usage Analytics Report - August 2015 Update
This post, and the Azure Usage Analytics Report described within, is an update to the post originally published here in March 2015.
Here are the key updates to this post:
- A new version of the Azure Enterprise Portal (https://ea.azure.com) was released in July 2015. The steps and screen shots in this post have been updated for the new portal.
- The detailed usage data available via the Azure Billing API was updated in July 2015 to include new columns and some column name changes. The updated report linked in this post supports these changes.
- I’ve also included steps for non-US based users to update this report for their local currency.
Analyzing usage data for Microsoft Azure can be very challenging. There are dozens of different services, each with their own billing meters and rates that can vary by region. To help simplify this task, I (along with my colleague Vipul Shah) created a Microsoft Excel-based report that enables you to analyze your Azure usage by department, account, subscription, service, region and time frame.
NOTE: This report only works for organizations that have licensed Azure via an Enterprise Program such as a Microsoft Enterprise Agreement. Licensing Azure via an Enterprise Program provides you access to the Azure Enterprise Portal and the Azure Billing API which are required for this report.
Here’s a link where you can download the report - Azure Usage Analytics Report.
Prerequisites
- Excel 2013 (or newer)
- Microsoft Power Query for Excel add-in (from Jan. 12th, 2015 or later). You can download the add-in here.
- This report also takes advantage of Power View, Power Pivot, PivotTables and PivotCharts which are all available as part of Office Professional Plus and Office 365 Professional Plus editions, and in the standalone edition of Excel 2013.
Here are a few steps to help get you started…
- Log in to the Azure Enterprise Portal (https://ea.azure.com). If you’re not set up as an Azure Enterprise Administrator on this portal then you’ll need to work with one of the Enterprise Administrators from your organization.
-
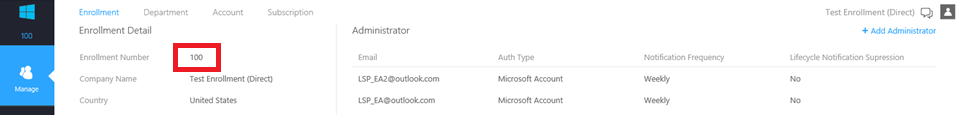
From the home page, grab your Enrollment Number
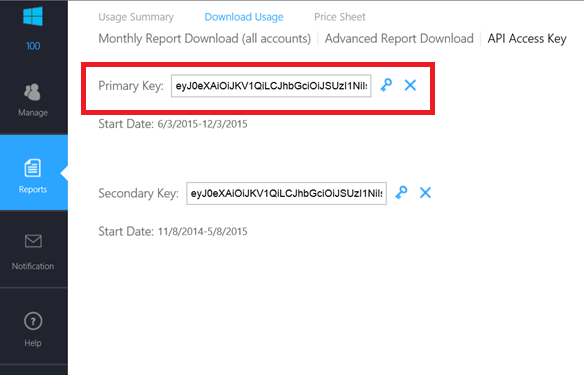
- Navigate to the Reports -> Download Usage -> API Access Key page
-
Grab the Primary Key or the Secondary Key. You may need to generate one of these keys if they don’t exist. A common issue when first using this report is caused by not grabbing the entire key. Be sure to use Ctrl+A in the Primary Key or Secondary Key field to select the entire Access Key. It’s a pretty long string.
- Now open the Azure Usage Analytics (API) Aug 2015.xlsx file that you downloaded from the link above.
- When prompted, click Enable Editing
- When prompted, click Enable Content
- FYI, the Get Started worksheet contains additional instructions for using the report
-
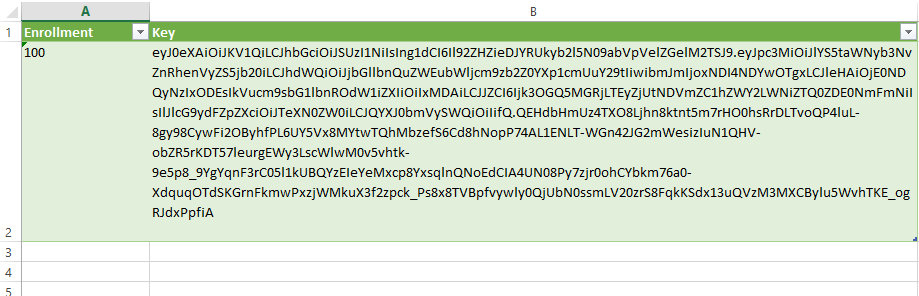
Navigate to the Enrollment Info worksheet. The Enrollment Info worksheet contains a single table with Enrollment and Key columns. It only contains a single row of data. Replace the existing Enrollment and Key values with your Enrollment Number and Access Key that you retrieved from the Enterprise Portal above. Make sure to delete all the characters for the existing Access Key and copy all the characters from your Access Key. It should look like this when you’re done but with your own values.
- Navigate to the Usage Analysis worksheet
- In the Excel Ribbon, select the Data tab and hit the Refresh All button.
-
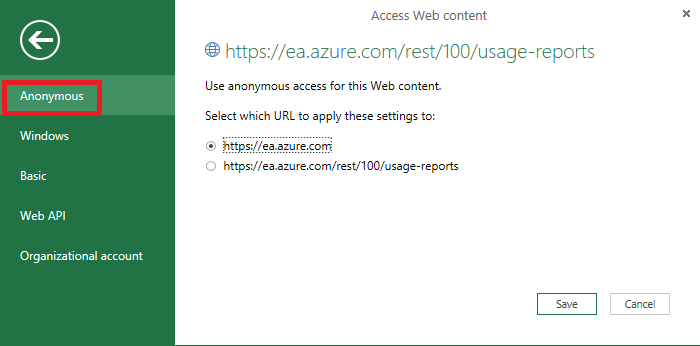
If you’re prompted to select the authentication type for accessing web content then select Anonymous as shown below. The Azure Billing API uses the access key in the HTTP header for authentication. It also uses HTTPS to encrypt data in-transit.
-
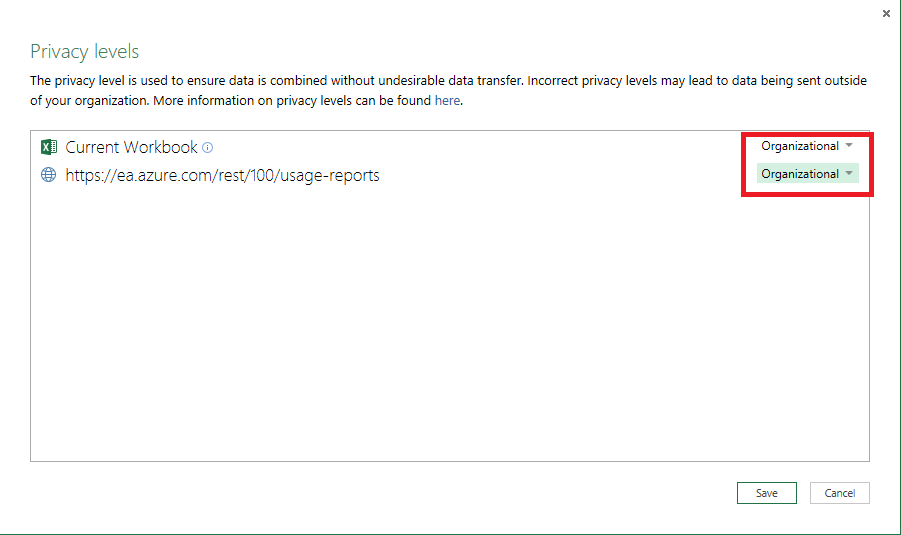
If you’re prompted to select privacy levels then select Organizational as shown below.
- The Excel status bar down at the bottom will update with messages as it retrieves data from the Azure Billing API. Don’t be surprised if it takes a few minutes to retrieve all your data which may consist of 100K+ rows.
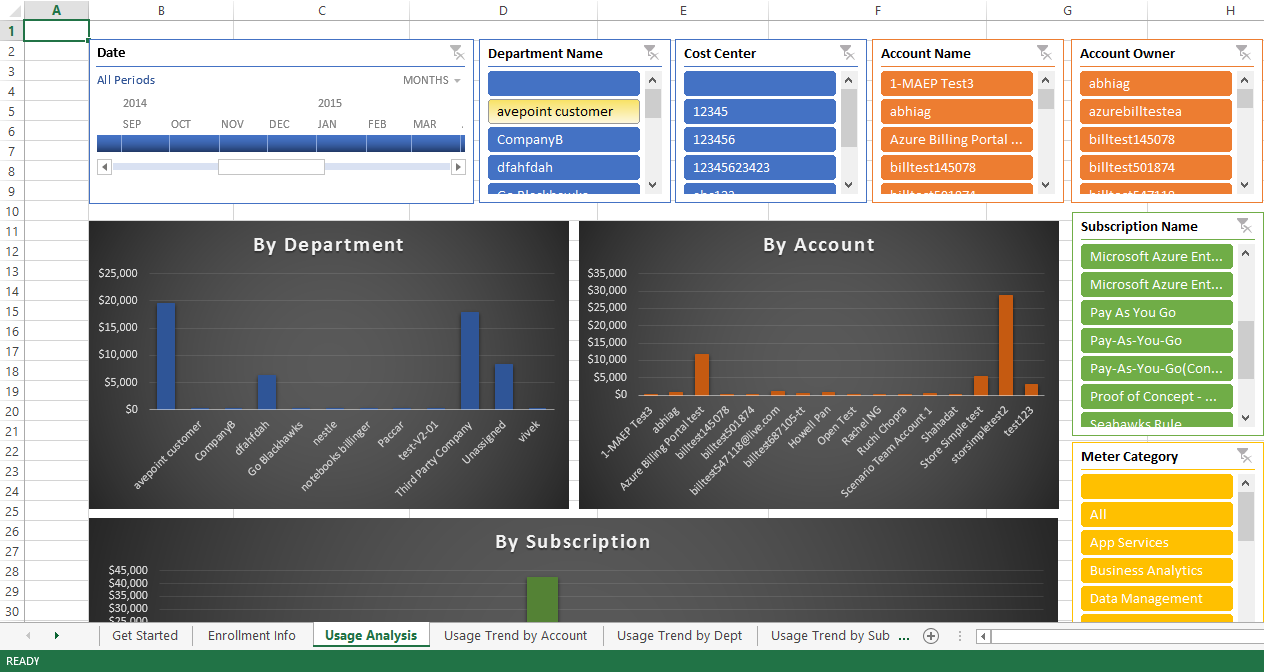
- Once your data has been retrieved, the PivotTable, PivotCharts and Slicers on the Usage Analysis worksheet will update. It will look something like this but with your own data.
- The remaining worksheets leverage Power View to show Usage Trend by Department, Usage Trend by Account, etc.
- Once you’re done analyzing your usage data, save the spreadsheet. This will save your Enrollment Number and Access Key so that in the future all you have to do is hit Refresh All on the Data tab to grab your latest usage data.
Update the report for non-US currencies
Here are a few steps that allow you to change the currency from USD to your local currency:
- Open the Azure Usage Analytics (API) Aug 2015.xlsx file if it’s not already open
- Go to the PowerPivot ribbon and click the Manage button in the Data Model section
- Make sure the Detailed Usage tab (at the bottom) is selected
- Select the ResourceRate column
- On the Home ribbon in the Formatting section, click the Apply Currency Format dropdown and select your local currency
- Do the same for the ExtendedCost column
- Close the PowerPivot for Excel Data Model
- Although changing the currency in the Data Model updates the PivotCharts, it does not update the PivotTable. Therefore, you will need to perform the following steps to update the currency in the PivotTable.
- Make sure you’re on the Usage Analysis worksheet
- Scroll down to the PivotTable and select a cell in the PivotTable so that the PivotTable Fields pane displays
- In the PivotTable Fields pane, scroll down to the Values area, click the Average of ResourceRate field dropdown and select Value Field Settings
- Click the Number Format button
- In the Symbol dropdown, select your local currency and click OK and OK
- Do the same for the Extended Cost field
- You can now close and save the Azure Usage Analytics (API) Aug 2015.xlsx file
**NOTE: Number formatting is set in Windows Control Panel -> Clock, Language and Region -> Change date, time or number formats. It’s possible that your Windows number format (e.g. period for decimal separator, comma for thousands separator) may be set differently than the number format used in the usage data. If this is the case then you can either change your Windows number format to match the usage data or update the PowerQuery to replace the separators.
Additional Info
You can get additional info on the Azure Billing API from these docs:
NOTE: This report is a sample of how you can use Excel and the Azure Billing API to analyze your usage data. It is NOT a supported tool from Microsoft. But since it is just a sample, feel free to customize it to meet your specific needs.
Enjoy!